


Genome #9: Statistics of salt and genomic surveillance
Tracking the status of Covid-19 genomic suriveillance over the past two years

... and, what is still extraordinary, I have met with a philosophical work in which the utility of salt has been made the theme of an eloquent discourse, and many other like things have had a similar honour bestowed on them.
— Pheadrus (Plato’s Symposium on Love)
As the British began dismantling their empire in southern Asia, millions of people had to migrate, and thousands, if not millions, lost their lives. In 1947, communal riots broke out in Delhi, the capital of India. The Red Fort, being a protected area, became a ‘shelter’ for refugees. A smaller number of refugees also took refuge at the nearby Humayun’s Tomb. The Indian government ensured the refugees were given food and other basic amenities. It entrusted contractors who would buy the raw material and cook meals to facilitate food. Keeping track of refugees daily was difficult for the government. Thus, it would pay the contractors a lump sum for all the commodities (and labor) purchased. The cost incurred was huge, and the government decided to consult statisticians for their ability to count.
The task for these statisticians was simple - estimating the number of total refugees. ‘Estimating’, because exact counting was hard for several reasons. First, the troubled conditions the refugees lived in made it difficult to count everyone. Second, the statisticians hired were from the majority community (the refugees belonged to the minority). Exact counting would require the statisticians to enter the Red fort area, and their safety could not be guaranteed. Estimating the counts called for a new strategy that would not require them to look at the concentration of people inside the area without prior information about the exact number of refugees/migrants. Giving up was not an option; ultimately, it was a matter of life and death.
"One death is a tragedy, 100,000 deaths are statistics."
The statisticians had access to the bills submitted by the contractors. Daily, the contractor would report just three quantities: the amount of Rice (R), Pulses (P kg), and Salt (S kg) in kilograms (kg). The government would then give them the price based on the current price of each of these commodities. These bills were very simple:
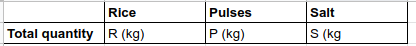
This information is insufficient to estimate how many refugees were being fed (which is a proxy for the total number of refugees). The statisticians also had access to consumption surveys conducted in the past. The surveys reported the per capita rate of consumption of these commodities: Rice (r kg/person), Pulses (p kg/person), and Salt (s kg/person). The estimation problem now becomes simple: the ratios R/r, P/p, and S/s provide a rough estimate of the total number of persons parallelly (i.e., they should ideally be very similar).

When the statisticians calculated these ratios, they were very different. The largest was R/r and the smallest was S/s. Salt was extremely cheap in 1947 (the salt taxes had recently been withdrawn only to be reintroduced a few years later). Over-reporting ‘S’ the quantity of salt would bring minimal profits to the contractors. It was the ‘R’ that would bring the most profits for the contractor. The contractors would exaggerate the amount of rice consumed; hence, the 'R/r’ based estimate would be grossly inaccurate. The statisticians suggested ‘S/s’ as a robust estimate for the number of refugees. This was then independently verified by doing a small survey at the Humayun’s tomb. It was possible to carry out such a survey at the tomb given it housed a smaller number of refugees from the minority community. The idea was ingenious, and it worked on the ground. The key is to focus on the right proxies for estimating the total numbers - it did not come from the absolute measures of the commodities consumed.
Statistics of India’s genomic surveillance
I have written multiple posts on the state of India’s genomic surveillance in the past: see part 1, part 2 and part 3 of the series. The fallacy of relying on the absolute numbers without considering the underlying per capita rate can also confuse us to see patterns that don’t exist. For example, in a 2021 report, the Wire claimed:
An RTI application filed by reporter Banjot Kaur with the NCDC elicited the opposite reply: the number of samples sequenced plummeted after June.
The NCDC also claimed to have no information about how much money had been allocated for the sequencing programme nor the time taken to sequence samples.
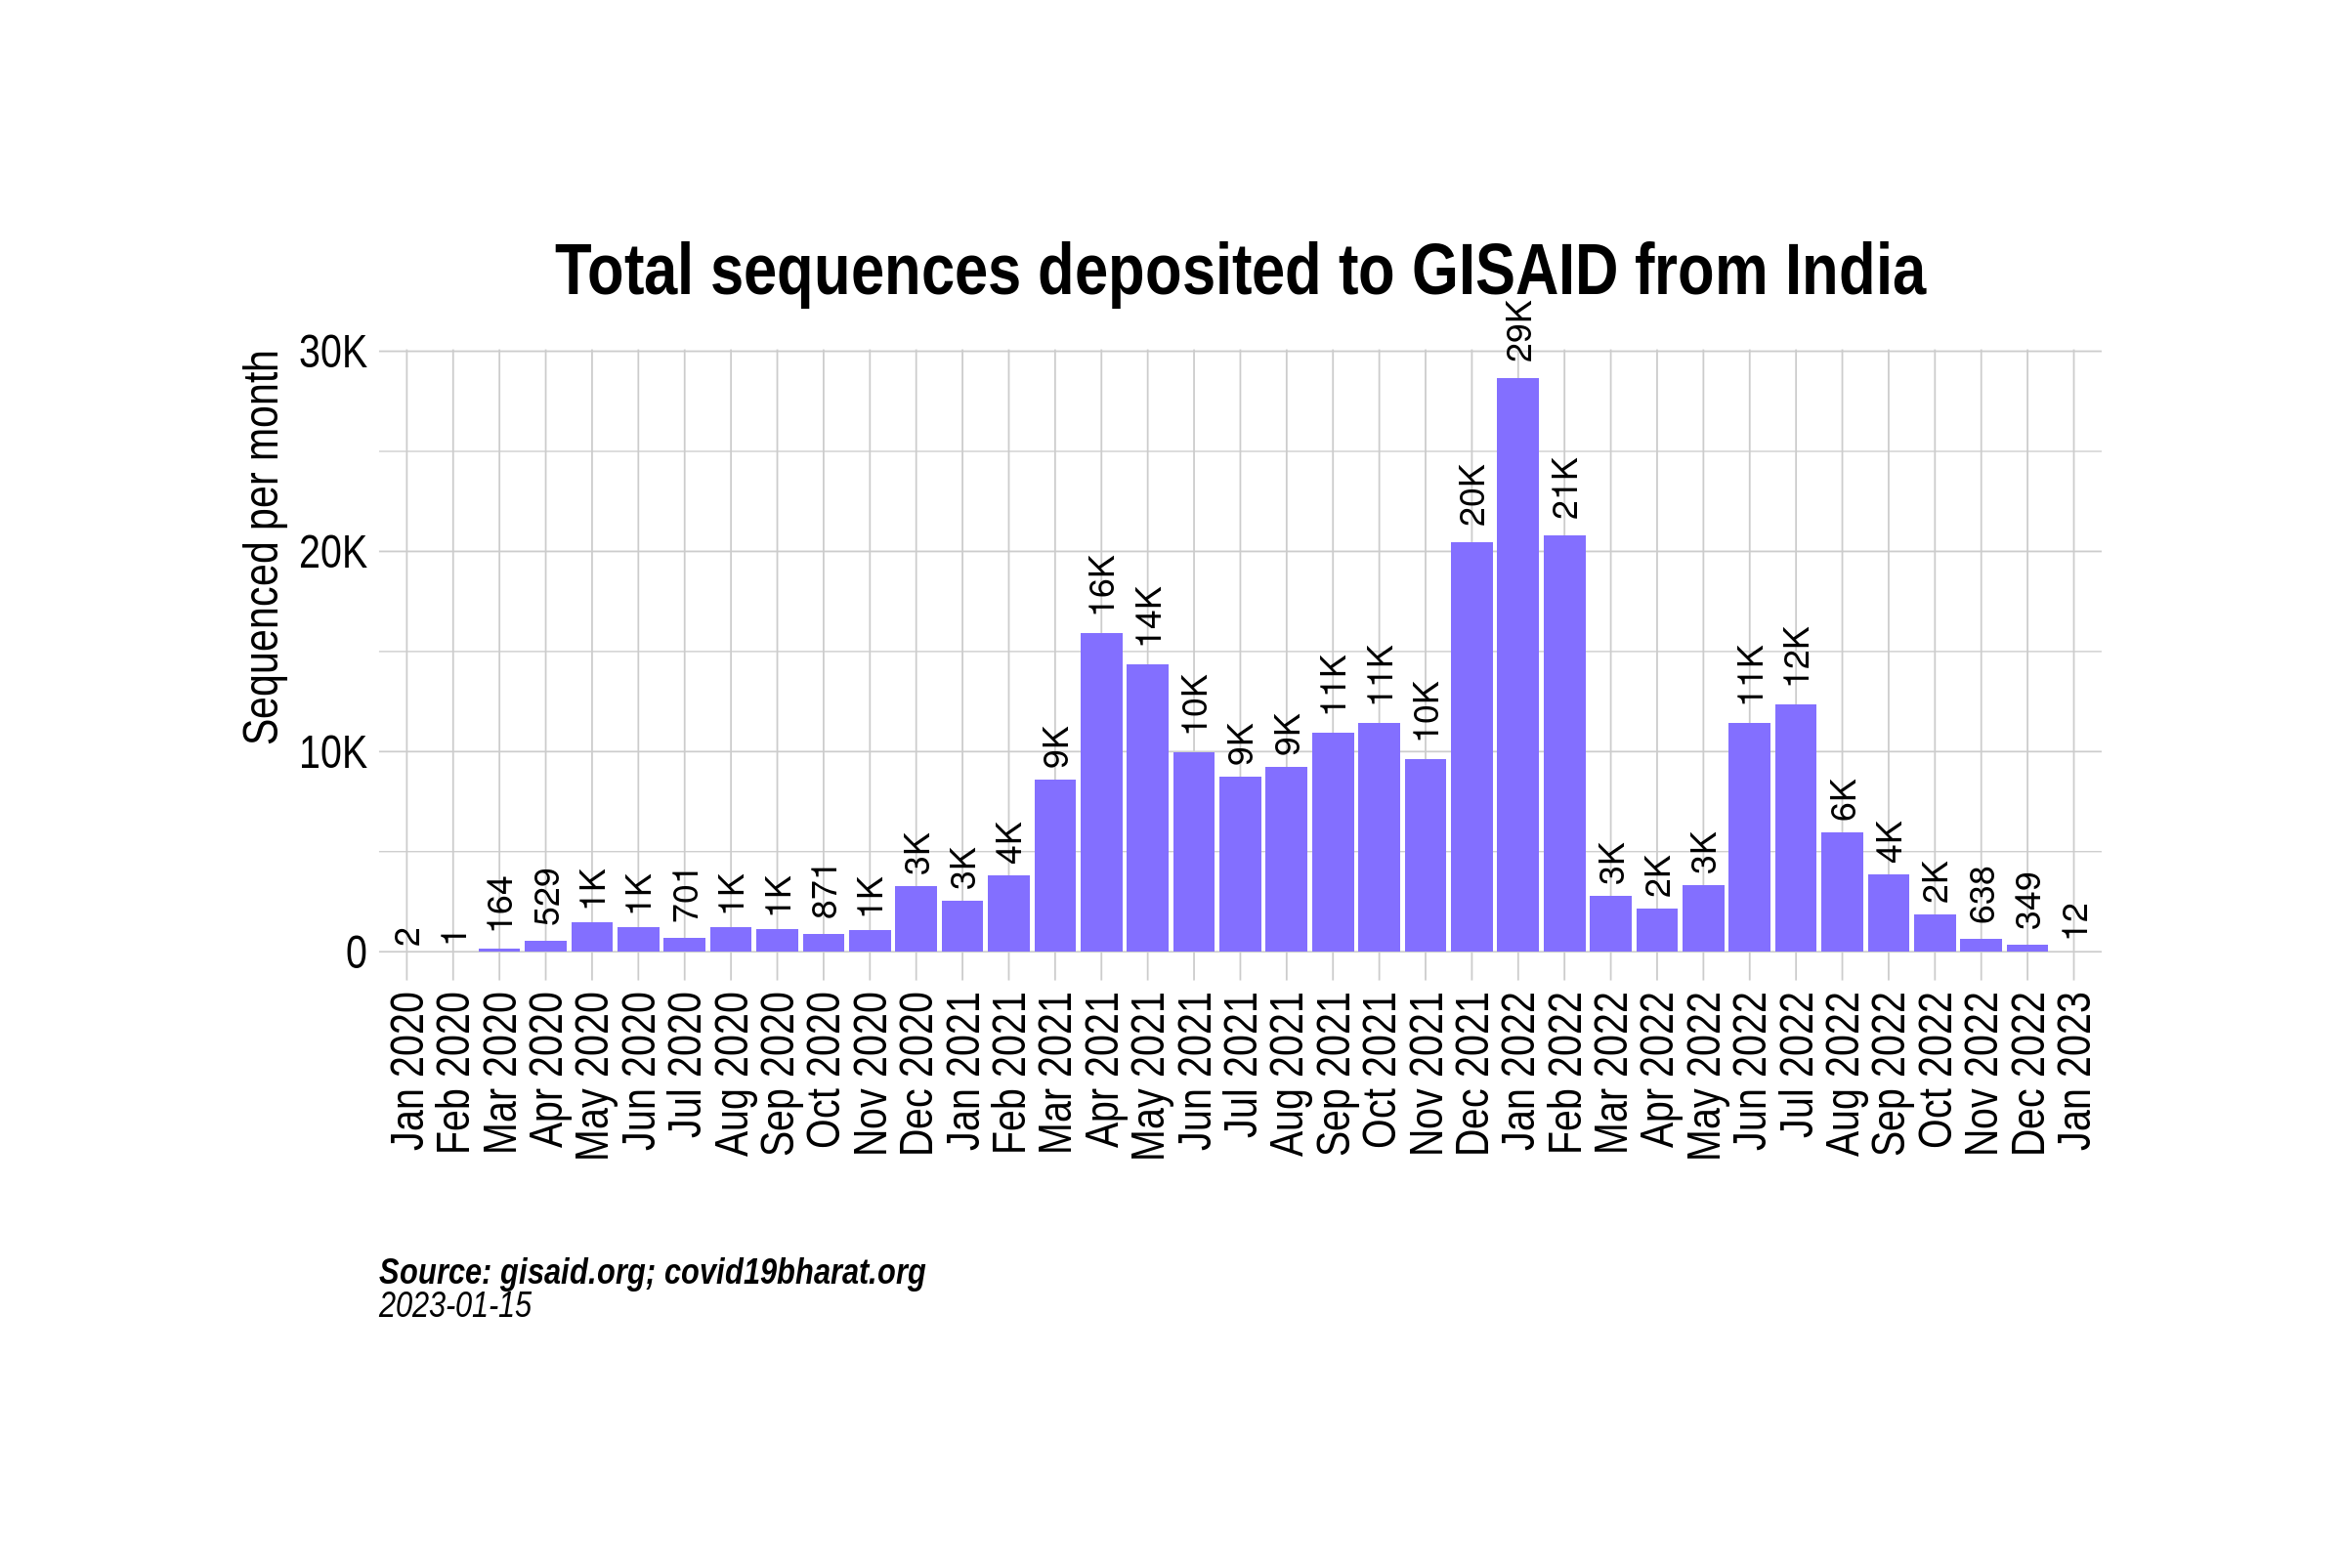
The rationale behind this claim was that the number of samples sequenced dropped from around 16,000 in April to around 9,000 in August 2021. As I showed in an earlier post, the right metric here is the relative number of samples being sequenced (i.e, the ‘per capita’ sequencing) and not the absolute numbers (i.e, the total cases). Similar to the ‘p’, ‘r’, ‘s’ approach taken by the statisticians in 1947, the focus should not be on the absolute numbers but on the percentage of samples sequenced. If we look at the total proportion of Covid-19 cases that have been sequenced and deposited to GISAID, an open repository where multiple countries upload SARS-CoV-2 genomic sequences, the picture becomes clearer:

Between April 2021 and August 2021, the sequenced samples' percentage increased from 0.2% to 0.8%, increasing at least 0.1% every month. This percentage remained high for most of 2022, but these are global aggregates - they hide the information at the states/union territories level. There is a massive difference in the total number of samples sequenced in each state:

How robust is genomic surveillance at the state level?
India’s genomic surveillance has made much progress in the past two years. The median delay in sequencing the sample and uploading it to GISAID is down almost by half to 37 days from 68 days in 2020.

The median percentage of samples being sequenced from India is up from 0.7% in 2020 to 2.94% in 2022. However, behind these median statistics hides the underlying heterogeneity across states. Not all states are sequencing well enough. Most sequencing proportions come from Gujarat, Tamil Nadu, Karnataka, Sikkim, and Telangana.

What is the advantage of sequencing? Sequencing is the only way to determine which variants drive the Covid-19 caseload. XBB 1.5., a subvariant of the Omicron variant, is now contributing to most cases (43%) in the US. The pattern is expected to trickle down to other countries, including India. It is already in India (though only ten samples have made it to GISAID so far), with the earliest sample dating back to 8th November 2022. It is not hard to guess which states have been able to detect it: Gujarat (5), Karnataka (1), Tamil Nadu (2), and Telangana (1) (the only exception being Kerala). These states also have a consistently higher proportion of sequencing - a corollary. While things have improved and the overall trend is in the right direction, there is still a lot to catch up on - the obvious one being addressing the intra-state variation.
A script to reproduce the analysis on this post is available here.
References
Rao, C. Radhakrishna. "Statistics and truth." Putting Chance to Work (1989).
Very informative. _/\_
Very interesting!