


Genome #8: Gompertz–Makeham law of mortality
On the burden of non-communicable diseases in India

One of the interesting concepts I came across recently is the Gompertz–Makeham law of mortality. This law fundamentally shaped the statistical machinery underlying life insurance and annuity pricing. When I first came across it, I imagined it would be a linear function of age (we accumulate risks as we age, after all). But instead, it is a kinked-J-shaped curve (Figure 1).

To summarize the graph, the risk of dying over much of the adult human lifespan increases exponentially with age. To rationalize this a bit, think about the risks we accumulate as we age: our organs deteriorate because of injury, stress, or multiple random mutations that happen all the time in the body, the cholesterol clogs the blood vessels, and the heart becomes less efficient.
The kink in the middle is attributed to death by external causes (Figure 2), which include road accidents, suicide, and homicide, besides drug overdose. Risks from these external causes are not fixed - they can change. For example, road accident-related deaths in India increased by 46% between 2006 and 2016, while Italy and Spain saw a decline of over 40% in the same period.

The J-shaped curve also reveals another insight - the risk of death past 45 years (at least in the US) is attributable to diseases. The J-shaped curve (including the minor kink at ~20 years) is not very different for India (Figure 3), despite the difference in overall life expectancy. The next obvious question was, which diseases affect life expectancy? The search for an answer drove me down a rabbit hole, and I came out with some interesting observations.

The burden of Non-communicable diseases
Non-communicable disease (NCD) is an umbrella term that encompasses all chronic conditions that do not result from an infectious process and hence are “not communicable”.
Disease burden is quantified using the disability-adjusted life year (DALY) statistic. One DALY is equivalent to the loss of one year of full health. For a disease or health condition, DALYs is the sum of years of healthy life lost to disability and years lost due to premature mortality.
The most significant contributor to India’s disease burden are NCDs (Figure 4). In 2019, NCDs led to 242 million DALYs accounting for 58% of total DALYs in India.

Why care about NCDs?
NCDs share modifiable risk factors, including tobacco and alcohol use, unhealthy diet, and lack of physical activity. An important risk factor for NCDs is air pollution, which has been consistently in the news over the past few years. These behavioral and risk factors lead to obesity, raised blood glucose, and raised blood pressure, subsequently increasing the risk of cardiovascular and respiratory diseases, diabetes, and cancers.
NCDs are the tip of the pyramid (Figure 5) whose base is established by underlying behavorial and physiological factors. It is easier to target the lower portion of this pyramid which is also the one that impacts a larger population.

Among the NCDs, cardiovascular (63 million DALYs) and respiratory diseases (29 million DALYs), and cancers (26 million DALYs) are the most significant contributors to the disease burden (Figure 6).

What percentage of the Indian population is at risk of NCDs?
A proxy to assess the risk of NCDs in our population is the prevalence of the underlying risk factors - hypertension and diabetes. National Family Health Survey of India conducts a nationwide survey where it collects reliable and up-to-date information on fertility, family planning, maternal and child health, sanitation, and mortality. NFHS-5 data was released in December 2020.
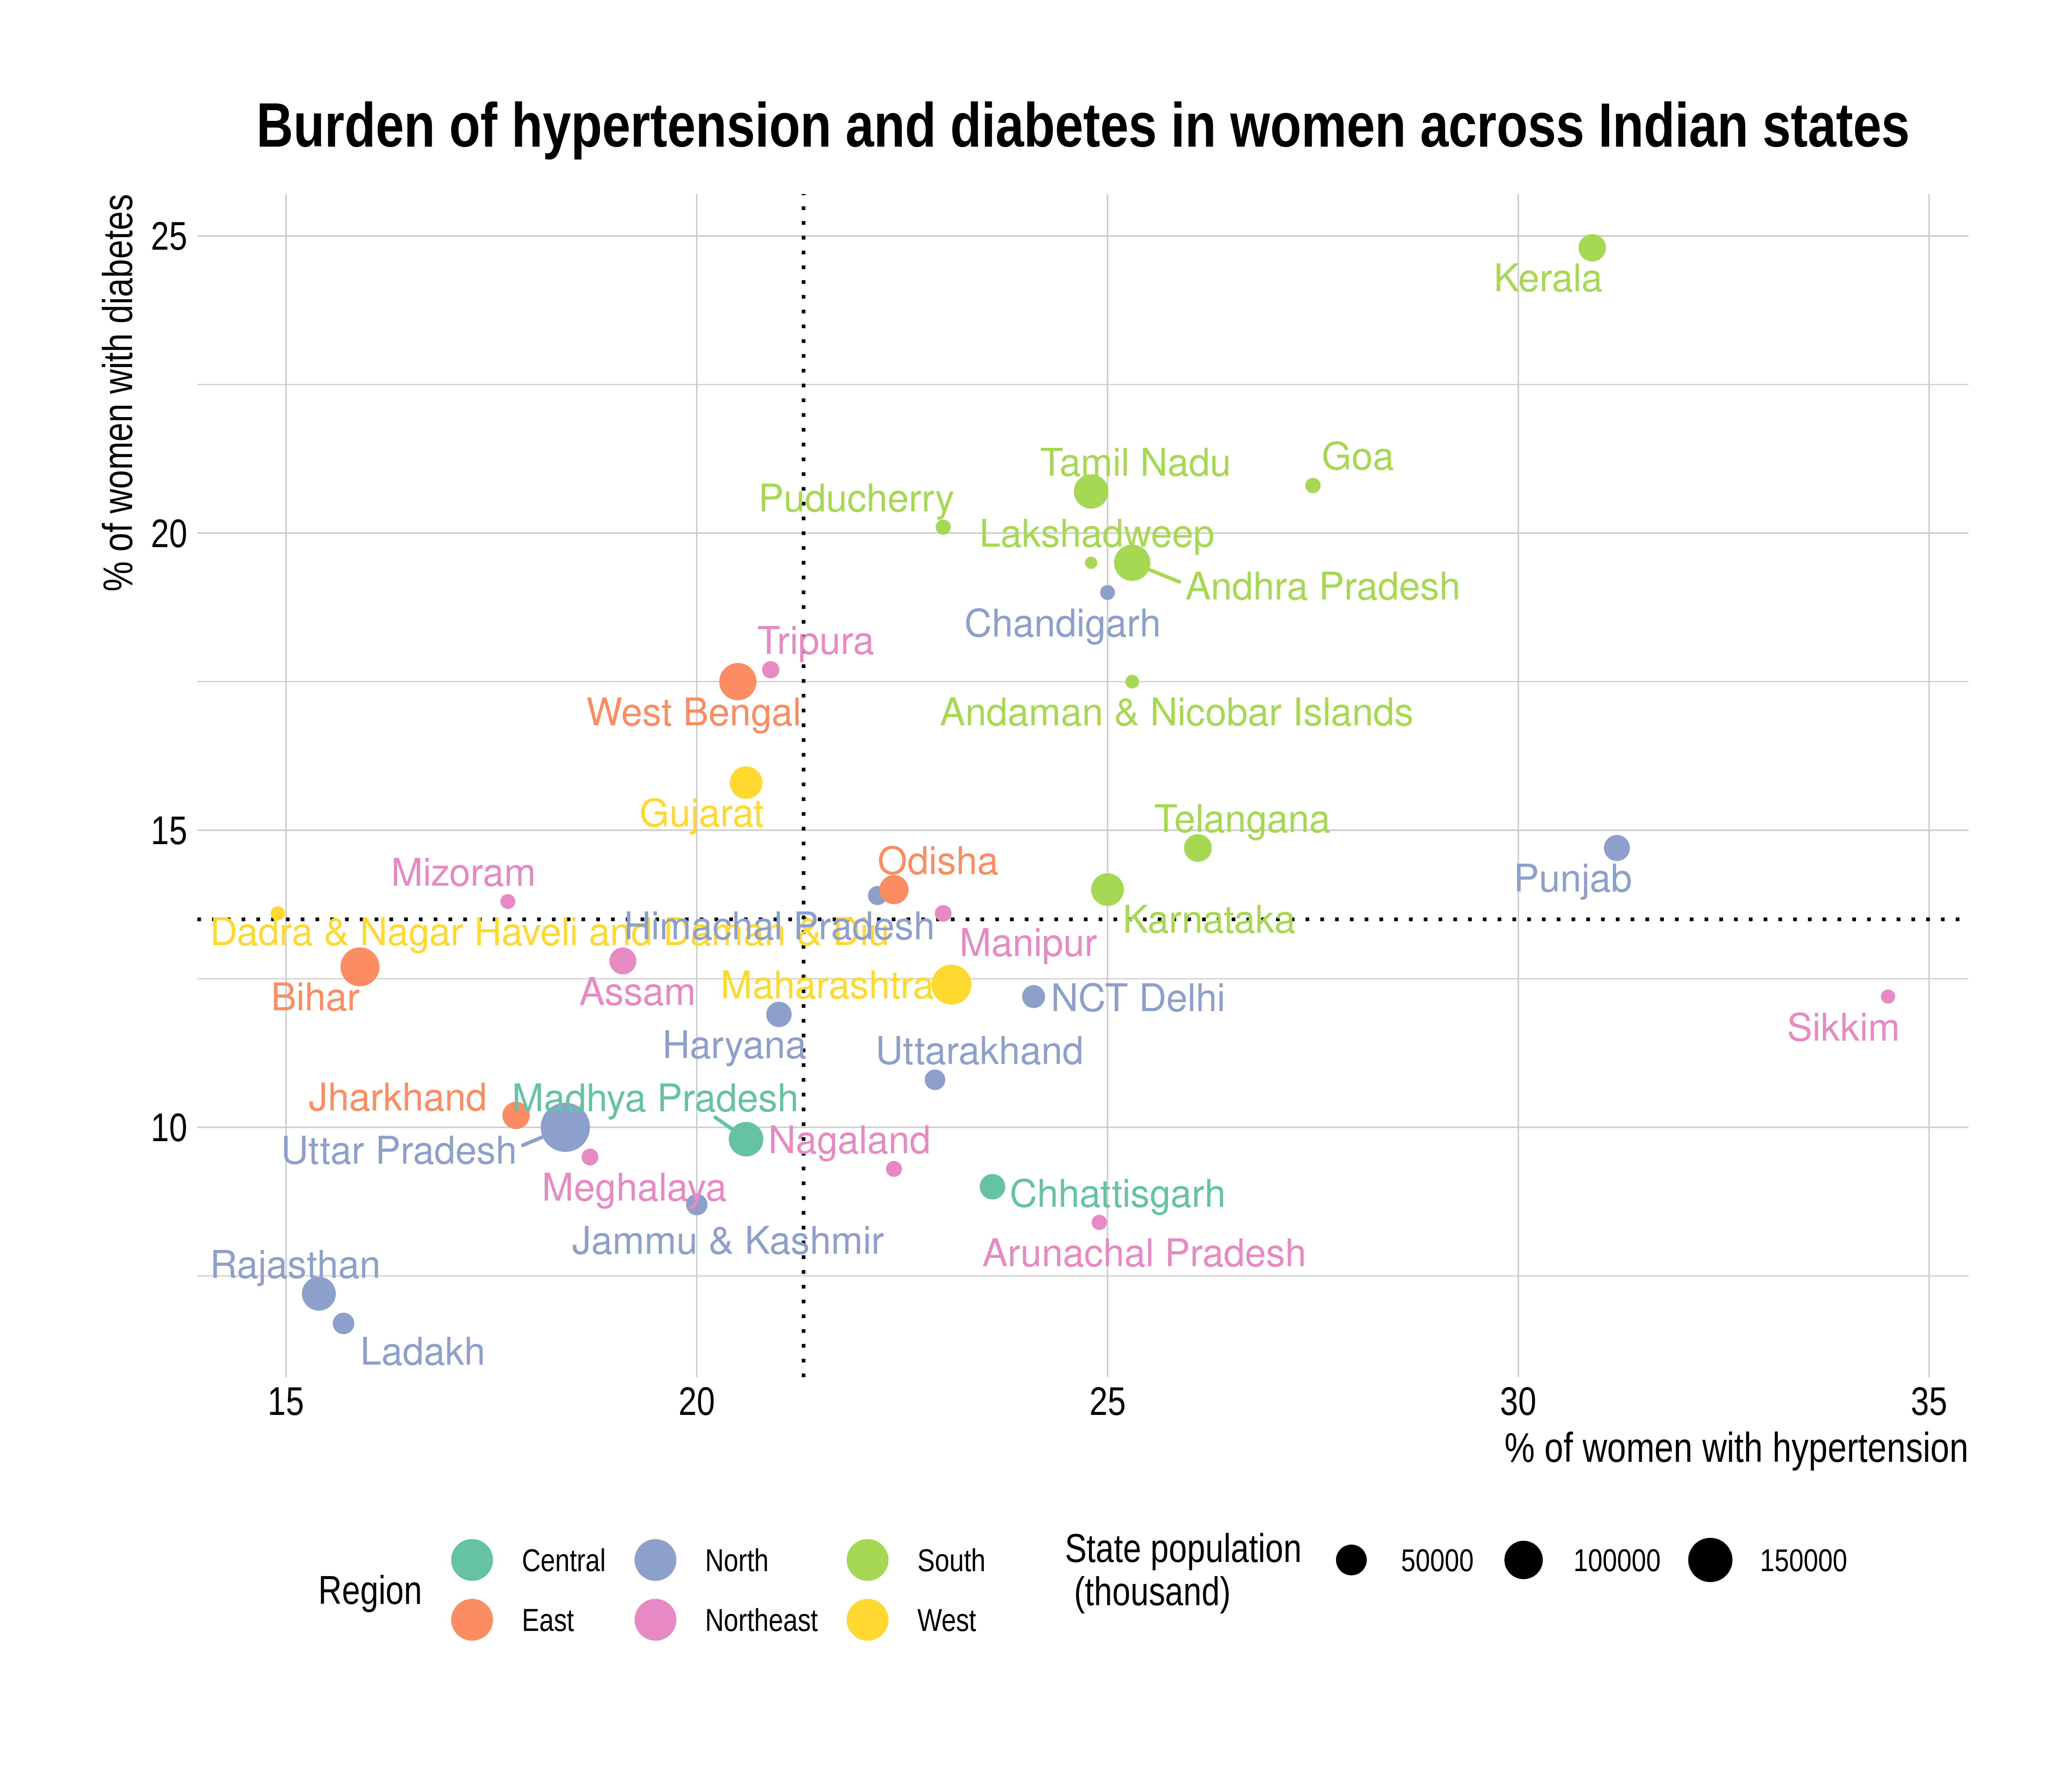
A staggering 24% of Indian men and 21.3% of women have hypertension. While 15.6% men have elevated blood glucose (diabetes), the prevalence among women is 13.6%. The most striking observation I made while analyzing the NFHS-5 data across states was the north-south divide (Figure 7A and 7B). The prevalence of hypertension and diabetes is higher in the southern and eastern states than in other states across both men and women.

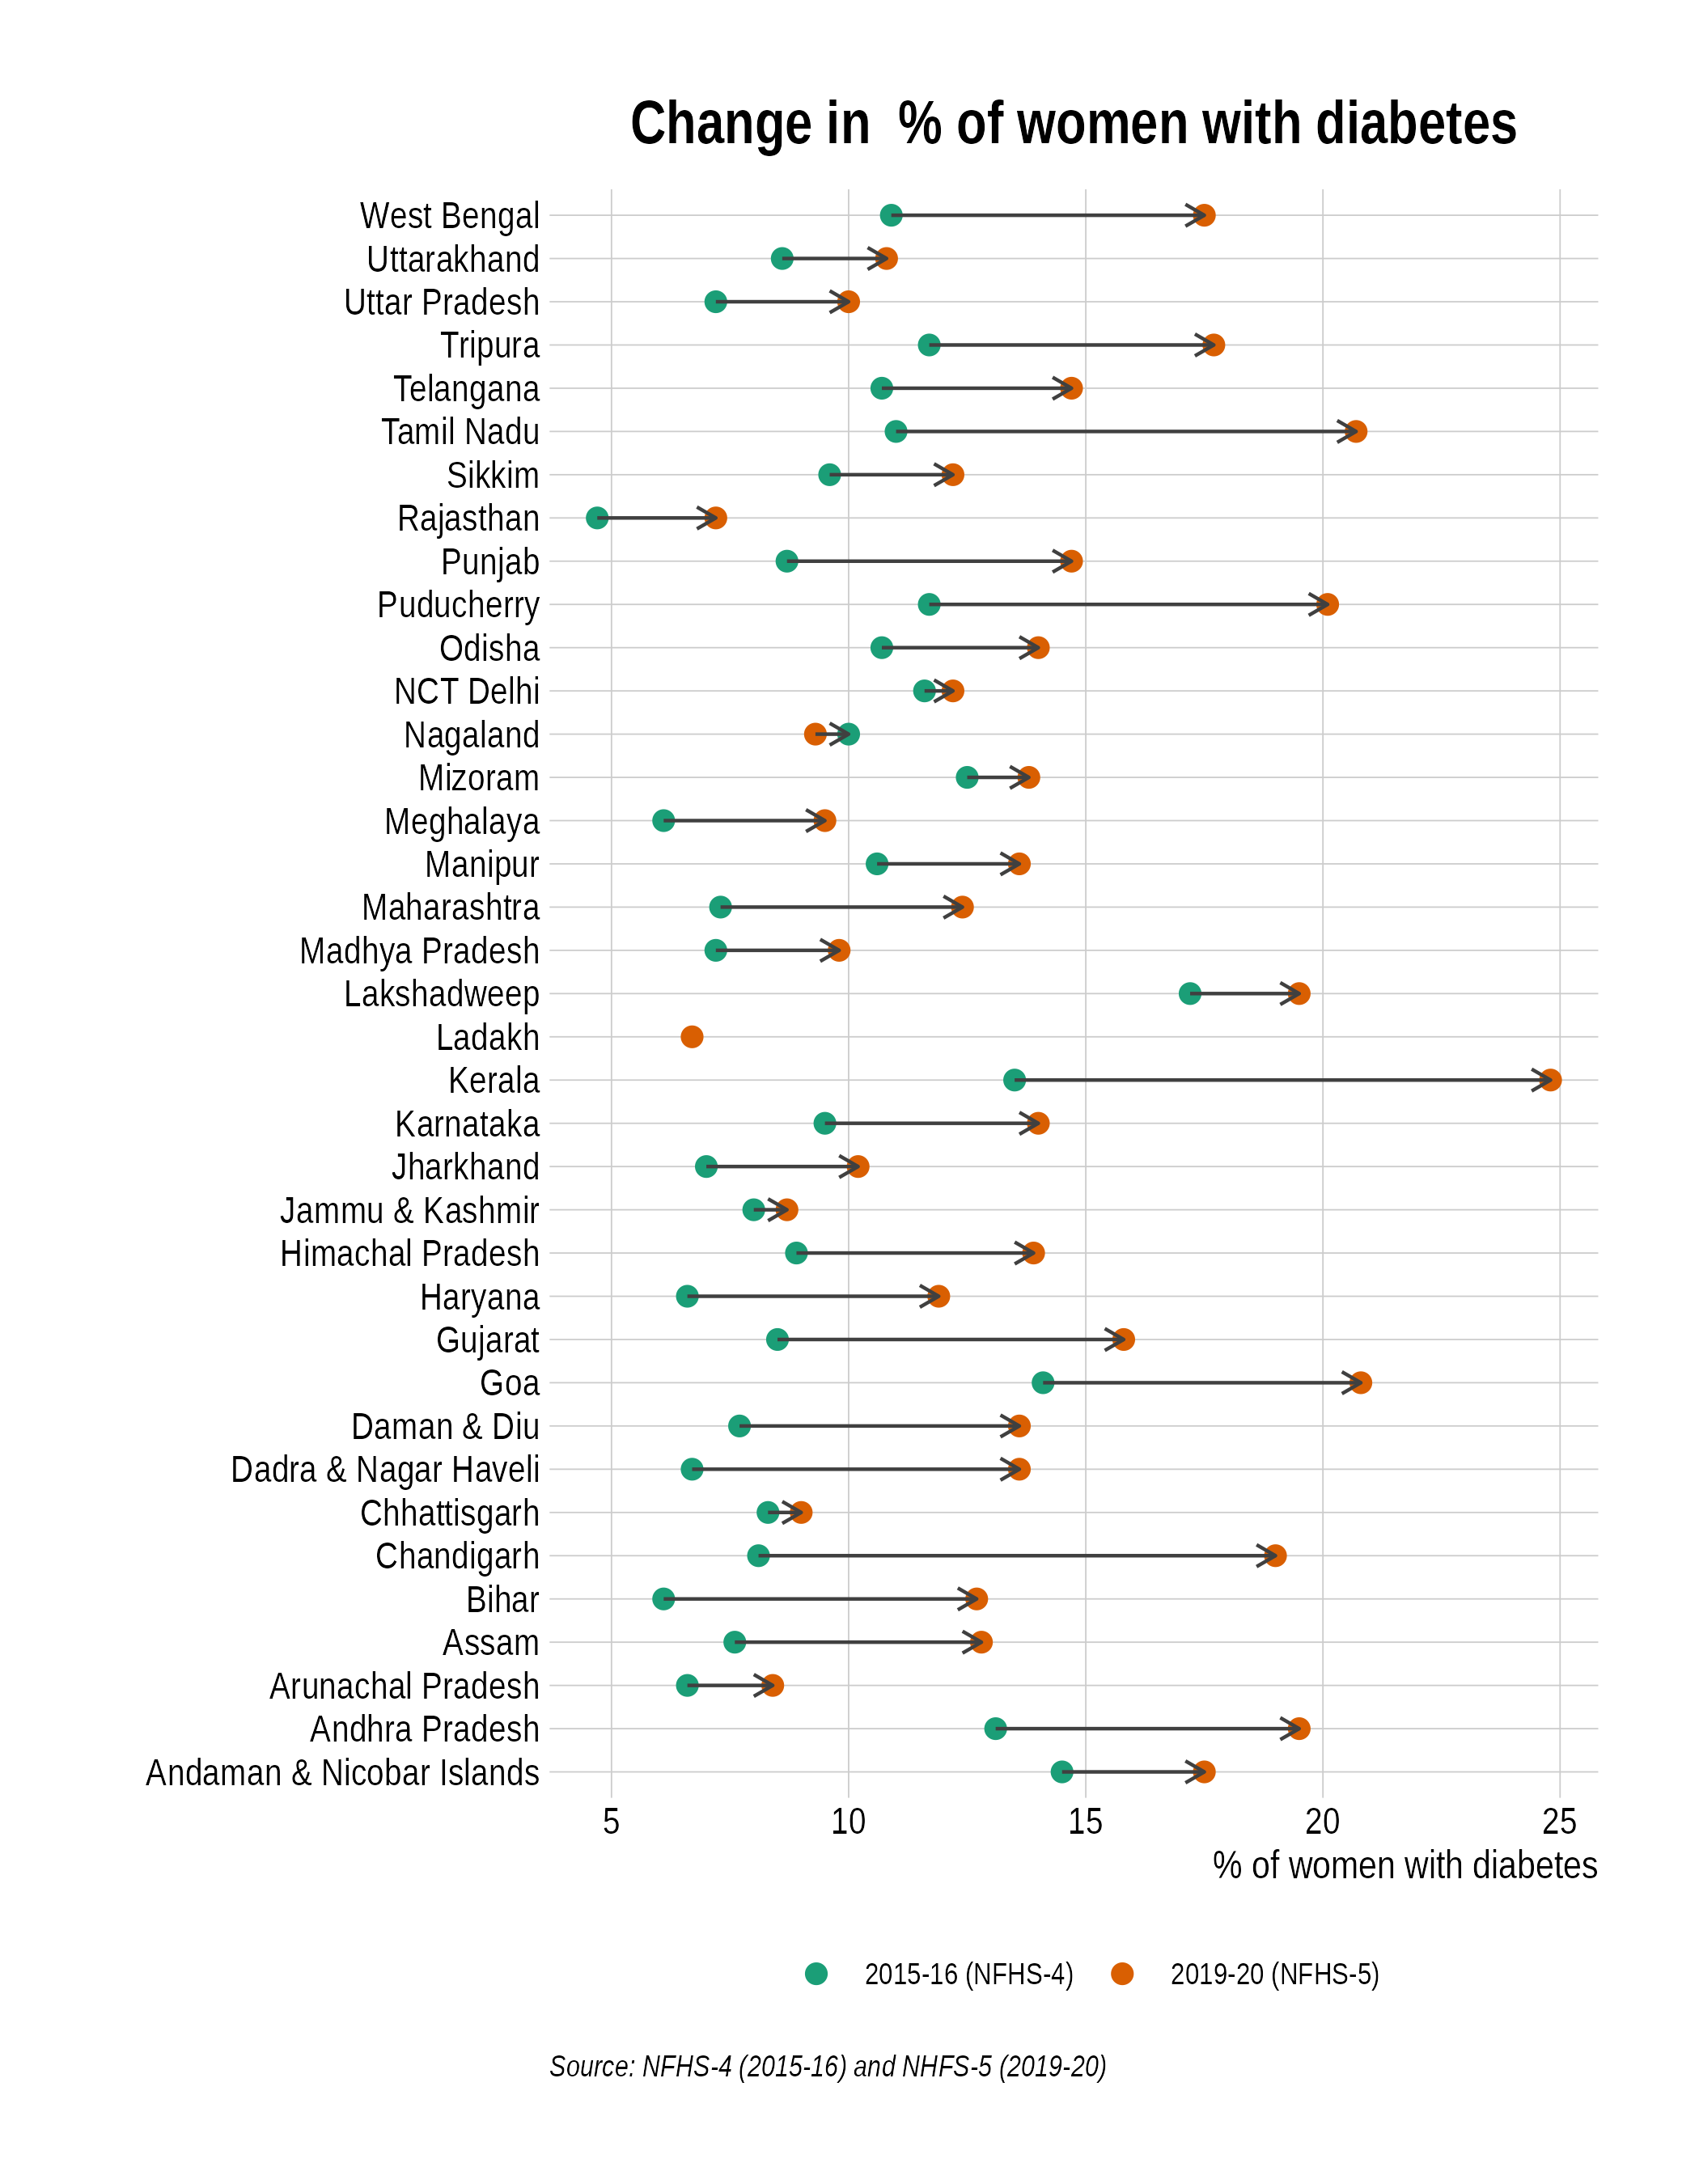
Even more surprising is how the prevalence of hypertension and diabetes has changed between NFHS-4 (2015-16) and NFHS-5 (2019-20). The trend itself is upsetting despite the difference in sample sizes across the two surveys (NFHS-4: 568,200 households; NHFS-5: 610,000 households). For example, in Kerala, the prevalence of hypertension among women went up from 6.8% to 30.9% between 2015 and 2019 (Figure 8A). In the same period, diabetes prevalence also doubled from 13.5% to 24.8% (Figure 8B).

The current statistics and trends on risk factors of NCDs are alarming. While I enjoyed jumping down the rabbit hole, the realization of a silent pandemic that has and will claim millions of life years every year is probably not the best realization I would have liked to end the year with. Happy new year, 2023!